Quantcast
Channel: ComponentSource News | Reporting Components
Viewing all 1653 articles
Browse latest View live

FastReport Online Designer released

$
0
0

Design reports using FastReport Online Designer.

Create, edit and view FastReport.NET reports on Windows, Android or iOS platforms.

FastReport Online Designer is a cross-platform visual report designer for FastReport.NET reports. It allows you to create and view reports as well as edit report templates compatible with FastReport.Net on devices with the Android, iOS or Windows platform. The designer can be run on any device with a modern browser whether it's a computer, tablet, smartphone, game console or a TV set. FastReport Online Designer is included in FastReport.NET Enterprise or is available as an additional option for users of FastReport.NET Win+WebForms or FastReport.NET Professional.

Features

  • Create, edit and view reports on Android, iOS or Windows devices. The designer can be run on any device with a modern browser.
  • Interaction with the user is automatically adjusted according to the platform's capabilities.
  • Includes full hotkey support.
  • Fast and lightweight.
  • Does not use Flash or Java technology.
  • The designer can then be used without an Internet connection after an initial load.

About Fast Reports

Founded in 1998 by Alexander Tzyganenko, Fast Reports, builds reporting applications, libraries and add-ons. It is an international company with offices in USA, Europe and Africa. They have dealers and partners in 50+ countries and have more than 20,000 customers worldwide


ActiveReports 10 released

$
0
0

Create cross-tab reports using the Tablix Data Region.

New features help you design and deploy tabular and pivot cross-tab reports.

ActiveReports is a reporting tool for HTML5, WPF, Windows Forms, ASP.NET and Windows Azure. It provides developers with familiar Visual Studio integrated designers and components, as well as an extensive API. Create reports ranging in functionality including form-based reports (invoices and insurance documents), transaction reports (sales and accounting) and analytical reports (sales and budget analysis and portfolio analysis).

Updates in 10

  • Tablix Data Region - The new Tablix data region supersedes the Matrix data region. It offers all of the features of the Matrix data region that let you visualize cross-tab and pivot tables, and introduces more display capabilities.
  • Word Rendering Extension for Export to DOCX Formats - Export RDL and Page reports to the Office Open XML document format, more commonly known by the file extension DOCX.
  • Style Sheets for RDL and Page Reports - Design consistently themed reports for groups of users and customers. Style sheets make it easy to change things like logos, colors, fonts, backgrounds and other style formats while keeping the same report layout design.
  • Execute Reports on the Server with any ActiveReports Viewer - With ActiveReports 10, server-side report execution is not limited to browser-based viewers. Now, even the WinForms and WPF viewers can run reports on the server using the thin viewer functionality. This means that your Windows Apps can leverage the server features to execute, cache, schedule, and secure reports. With the thin viewer functionality, you can:
    • Execute reports on the server while working within the Visual Studio IDE design environment or in an ActiveReports End User Designer control.
    • Use managed resources from the server such as shared data sources and shared data sets while designing and previewing reports.
    • Preview reports with built-in multi-tenancy support within the report designer.
  • Performance Enhancements with the New Layout Engine - New layout engine is lighter and faster at rendering reports.

About GrapeCity

GrapeCity has been in the software business for over 25 years. Its corporate headquarters are located in Sendai, Japan, with US headquarters in Kirkland, WA and operations spanning throughout the United States and Asia. GrapeCity is also the world's largest component vendor. Its award-winning tools benefit leading corporations, software companies and independent consultants around the world as a cost-effective solution for building distributed enterprise-wide applications for commercial or in-house use.

ActiveReports 10 Server adds Administrator Dashboard

$
0
0

HTML5 Administrator Dashboard.

New HTML5 Dashboard simplifies server administration.

ActiveReports Server is a scalable, load balanced, distributed platform thats helps optimize report deployment. It includes support for multi-tenant reporting, security, extensibility, data caching and report optimization. ActiveReports Server is an optional add-on for ActiveReports.

Updates in 10

  • Server Data Sources - Server data sources are managed by an Administrator, and developers can use them independently to access data. This helps IT administrators and DBAs to control data access and to keep access credentials secure.
  • Server Data Sets - Server data sets work with server data sources to provide more control over what the report author can see when designing reports. With server data sets, administrators and DBAs have the ability to control what queries run on the data source to get report data.
  • HTML5 Administrator Dashboard - New Administrator Dashboard includes an improved user experience that simplifies server administration.
  • New HTML5 Report Portal - The Report Portal remains customizable, so you can create the look and feel that you want using standard CSS files.
  • Public RESTful API - The new RESTful API provides developers with the building blocks to use the server as a service endpoint.

About GrapeCity

GrapeCity has been in the software business for over 25 years. Its corporate headquarters are located in Sendai, Japan, with US headquarters in Kirkland, WA and operations spanning throughout the United States and Asia. GrapeCity is also the world's largest component vendor. Its award-winning tools benefit leading corporations, software companies and independent consultants around the world as a cost-effective solution for building distributed enterprise-wide applications for commercial or in-house use.

ComponentOne Ultimate 2015 v3 released

$
0
0

FinancialChart for MVC and Xuni FlexChart.

Adds new controls to ComponentOne Studio, Wijmo and Xuni.

ComponentOne Ultimate delivers all the tools and components that Windows, Web, or Mobile developers need to create any type of application, whether it be for WinForms, WPF, WinRT, ActiveX, ASP. NET MVC, ASP. NET Web Forms, LightSwitch, Silverlight, UWP, Windows Phone, iOS or Android. Ultimate includes every ComponenentOne Studio platform as well as Web API, OLAP, XapOptimizer and IntelliSpell controls, plus Wijmo 5 (HTL5/JavaScript controls) and Xuni (native controls for iOS, Android and Xamarin).

Updates in 2015 v3

FlexReport for WinForms

  • Fast and lightweight reporting control.
  • Enhanced Crystal Reports compatibility.
  • Collate data from several sources.
  • Data sorting and filtering.
  • 70+ chart types for advanced data visualization.
  • Twice as fast as C1Report.

FinancialChart for MVC

  • Instantly access stock trending visualization.
  • Analyze with trend lines, filters, range selectors and annotations.
  • Combine charts for a customized dashboard.
  • Heikin-Ashi, Line Break, Renko, Kagi, ColumnVolumn, EquiVolume, CandleVolume, Arms CandleVolume chart types.

Web API Edition Released with a new REST API

  • Generate Excel files from a .NET collection, data table, data view, XML or JSON data.
  • Convert between different formats including Excel, JSON, CSV and XML.
  • Merge multiple Excel files to create a single file and keep formulas and styles intact.
  • Generate a barcode image stream on-the-fly.

Wijmo FlexSheet Control

  • Produce an Excel-like experience in your web app.
  • Import spreadsheets, apply formulas and export data to Excel.

Xuni FlexChart Updates

  • Display a label on the chart with relevant, exact information about a single position. Users can drag the marker to reveal data point information anywhere on the plot.
  • Customized axis labels allow developers to organize the layout into a more mobile-friendly design.

Xuni FlexGrid Updates

  • Allow columns to stretch and fill the available space.
  • Freeze columns and rows to keep cells in view as the user scrolls.
  • Resize columns using touch.

Xuni CollectionView Updates

  • Incremental, on-demand loading in iOS and Android.

About GrapeCity

GrapeCity has been in the software business for over 25 years. Its corporate headquarters are located in Sendai, Japan, with US headquarters in Kirkland, WA and operations spanning throughout the United States and Asia. GrapeCity is also the world's largest component vendor. Its award-winning tools benefit leading corporations, software companies and independent consultants around the world as a cost-effective solution for building distributed enterprise-wide applications for commercial or in-house use.

ComponentOne Studio WinForms 2015 v3 adds FlexReport

$
0
0

Access different report sources in a single viewer.

A fast, flexible reporting tool for modern business.

ComponentOne Studio WinForms includes the controls you need to build touch-enabled, modern-looking, high-performance applications. Display and visualize data with grids, charts, gauges and reports. You can also build User Interfaces with a Ribbon, tile control, input panels and take advantage of PDF controls and a full reporting solution.

Updates in 2015 v3

FlexReport for WinForms

  • Fast and lightweight reporting control.
  • Enhanced Crystal Reports compatibility.
  • Collate data from several sources.
  • Data sorting and filtering.
  • 70+ chart types for advanced data visualization.
  • Twice as fast as C1Report.

FlexPivot for WinForms (Beta)

  • Process millions of rows of data from dozens of different data sources in milliseconds.
  • Create dynamic, summarized views by dragging data fields on the UI.
  • Deliver data from online or local cubes that users can drill-down and parse more meaningfully.

New Features and Enhancements:

PDF for .NET

  • New AddBookmark method allows users to add bookmarks within a PDF.
  • New support for PDF/A-2B format for exporting reports and documents.

GanttView

  • ChartStartDate and ChartFinishDate properties can bound the scrolling area in chart view.
  • Users can select and make simultaneous changes in multiple rows and columns.
  • You can now split a task into parts.

InputPanel

  • MaxDropDownItems property sets the maximum number of items displayed in the drop-down list without scrolling.
  • GripHandleVisible property sets whether the drop-down list can be resized.

Command

  • C1TopicBar now has keyboard support.
  • You can now hide the “Customize” option in the “Add or Remove Buttons” menu.
  • C1TopicBar.LinkStyle property sets the style of links on pages.

TrueDBGrid

  • Performance has been improved when assigning new data in unbound mode with the Frame.AddRows(count) method.

About GrapeCity

GrapeCity has been in the software business for over 25 years. Its corporate headquarters are located in Sendai, Japan, with US headquarters in Kirkland, WA and operations spanning throughout the United States and Asia. GrapeCity is also the world's largest component vendor. Its award-winning tools benefit leading corporations, software companies and independent consultants around the world as a cost-effective solution for building distributed enterprise-wide applications for commercial or in-house use.

MindFusion.Reporting for WPF adds Barcodes

$
0
0

Display barcodes in reports using MindFusion.Reporting for WPF.

Reports can now display UPC-A, UPC-E, EAN-8, EAN-13 and QR barcodes.

MindFusion.Reporting for WPF is a component that adds a wide range of reporting features to your business applications. It supports all .NET data sources and is compatible with ADO.NET. You can work in both bound and unbound mode and are not restricted to the number of data sources that are used in a single report. Each report consists of pages and each page can have a header and a footer that are template-based. You can also customize the layout and appearance of each page and of each report item. The report can have as many report items as you wish.

Updates in V1.4

  • Report Parameters - Parameters can now be added to a report using the new Parameters collection of the Report class.
  • Barcodes - MindFusion.Reporting for WPF reports can now display UPC-A, UPC-E, EAN-8, EAN-13 and QR barcodes.
  • Improved Charts - Several new properties have been added to the LineChart class to improve customization for plot, grid, legend and axes.
  • Report items can be searched by name using the new FindItem method.
  • Items in data range headers and footers can now bind to the data source of the data range.

About MindFusion Group

MindFusion Group was founded 2001 in Bulgaria by providing outsourcing services to clients from all over the world. During 2003 MindFusion developed its first ActiveX diagramming control. MindFusion quickly became dedicated to the development of reusable software components focusing on software engineers from all over the world.

Stimulsoft Reports.Ultimate adds WPF Maps

$
0
0

A sample map created using Stimulsoft Reports.Ultimate.

Visualize geographical data in your reports.

Stimulsoft Reports.Ultimate includes a set of tools to build reports in JavaScript, ASP.NET, ASP.NET MVC, WPF, Silverlight, WinRT, HTML5, Windows Forms, PHP, Java, and Flex.environments. It includes report designers, which can be run at design and run time, as well as viewers for displaying reports. You can use the system to export reports in a number of different formats.

Updates in 2015.3

  • JavaScript Report Engine in PHP - The PHP reporting controls now contain an HTML5 viewer and designer. They are no longer limited by Flash technology.
  • New WPF Maps - Visualize geographical data in your reports.
  • Variables in Queries - Reports.Net and Reports.Wpf can now use variables to make queries easier.
  • Drag and Drop Components in HTML5 Designer - Reports.Web now includes the ability to drag components from the Insert tab directly into a report template.
  • Primitives Exporting - In Reports.Net, Reports.Wpf and Reports.Web all barcodes and shapes are now exported as primitives rather than images.
  • Data Sources in Reports.JS - Data can now be obtained from an OData data source, Excel file, Firebird, MS SQL or MySQL database.
  • Expressions for JSON and XML in Reports.JS - Now supports expressions that enable you to create a JSON or XML data source.
  • Barcodes in Reports.JS - Supports more than 30 types, including QR Code barcodes.
  • Touch Interface in Reports.Java - You can now easily view reports, navigate and export, using your mobile device.

About Stimulsoft

Stimulsoft specializes in the development of reporting components for the Microsoft.NET Framework. Customer satisfaction is the company's first priority and as such it aims to produce quality software. Stimulsoft helps developers to incorporate advanced technologies into their applications.

DevExpress Universal 15.2.3 released

$
0
0

Create form layouts of any complexity with dxForm.

New version adds new HTML5 Form Layout Widget.

DevExpress Universal is a comprehensive software development toolset for .NET developers and contains the DevExpress DXperience and DevExtreme Mobile products. It helps you build applications for Windows, Web, mobile and tablet, including WinForms, ASP.NET, WPF, Silverlight and Windows 8. Use the DevExtreme tools for building multi-channel applications for iPhone and Android smartphones and for iPad and Microsoft Surface tablets. It also includes CodeRush and the award winning eXpress Application Framework (XAF).

Updates in 15.2.3

  • WinForms Diagram Control - Visually communicate complex information using data-linked diagrams and flowcharts.
  • WinForms Date Editor and Calendar - The calendar used in the WinForms Date Editor is now available as a standalone control that can be dropped directly onto a form.
  • WinForms Excel Data Source - Bind DevExpress WinForms data-aware controls to Microsoft Excel workbooks or CSV files.
  • Office Inspired Ring/Line Animations - The WinForms Progress Panel and Transition Manager now support Office inspired animation styles.
  • WinForms Tabbed Form - Incorporates a Tabbed MDI interface which allows you to eliminate the use of MDI managers.
  • WinForms Tabbed Pane Control– A SDI (Single Document Interface) navigation control that owns a collection of pages and uses buttons to navigate between them.
  • WinForms Toolbox Control - A Microsoft Visio inspired Toolbox control.
  • ASP.NET CardView Control - Build a Microsoft Outlook inspired Contacts View with integrated data shaping and editing capabilities.
  • WPF Camera Control - Display a video stream from a webcam and take a snapshot.
  • WPF Clipboard Manager - Copy data from the DevExpress Grid and TreeList Controls to MS Word, Excel and Outlook while preserving the original formatting.
  • WPF TreeMap Control - Visualize flat or hierarchically structured data using nested rectangles that are sized and ordered.
  • UWP Ribbon Control - Includes Ribbon items, Backstage View, Mobile View and MVVM support.
  • UWP Hamburger Menu and Hamburger Frame - New Hamburger Menu and Hamburger Frame controls.
  • WPF Report Designer - A feature-rich end-user reporting tool for WPF with a new Report Wizard and Data Source Wizard.
  • HTML5/JS Widgets dxForm - Client-side widget designed to simplify how you create and layout forms.

About DevExpress (Developer Express)

DevExpress (Developer Express) is a software development company based in the United States. It produces coding assistance tools and components for Delphi, C++ Builder and Microsoft Visual Studio developers. The major part of its product line is VCL, .NET WinForms and ASP.NET components that replicate the UI of Microsoft Windows and Microsoft Office applications. Developer Express has won many industry awards for its products.


DevExpress DXperience 15.2.3 released

$
0
0

New Windows Application Themes in DevExpress DXperience.

Adds new controls for WinForms, WPF, ASP.NET and Windows 10 Apps.

DevExpress DXperience delivers the capabilities you'll need to build compelling, high-impact desktop, Web and mobile solutions. DevExpress DXperience Subscription is a feature-complete software development toolset for .NET developers. It includes all DevExpress Controls for WinForms, ASP.NET WebForms, ASP.NET MVC, WPF, Reporting, Windows 10 Apps plus the award-winning Visual Studio Add-In CodeRush, in one integrated package.

Updates in 15.2.3

  • WinForms Diagram Control - Visually communicate complex information using data-linked diagrams and flowcharts.
  • WinForms Date Editor and Calendar - The calendar used in the WinForms Date Editor is now available as a standalone control that can be dropped directly onto a form.
  • WinForms Excel Data Source - Bind DevExpress WinForms data-aware controls to Microsoft Excel workbooks or CSV files.
  • Office Inspired Ring/Line Animations - The WinForms Progress Panel and Transition Manager now support Office inspired animation styles.
  • Office 2016 Inspired Theme - Adds new Office 2016 Colorful Theme and Office 2016 Black Theme.
  • WinForms Tabbed Form - Incorporates a Tabbed MDI interface which allows you to eliminate the use of MDI managers.
  • WinForms Tabbed Pane Control– A SDI (Single Document Interface) navigation control that owns a collection of pages and uses buttons to navigate between them.
  • WinForms Toolbox Control - A Microsoft Visio inspired Toolbox control.
  • ASP.NET CardView Control - Build a Microsoft Outlook inspired Contacts View with integrated data shaping and editing capabilities.
  • WPF Camera Control - Display a video stream from a webcam and take a snapshot.
  • WPF Clipboard Manager - Copy data from the DevExpress Grid and TreeList Controls to MS Word, Excel and Outlook while preserving the original formatting.
  • WPF TreeMap Control - Visualize flat or hierarchically structured data using nested rectangles that are sized and ordered.
  • UWP Ribbon Control - Includes Ribbon items, Backstage View, Mobile View and MVVM support.
  • UWP Hamburger Menu and Hamburger Frame - New Hamburger Menu and Hamburger Frame controls.
  • WPF Report Designer - A feature-rich end-user reporting tool for WPF with a new Report Wizard and Data Source Wizard.

About DevExpress (Developer Express)

DevExpress (Developer Express) is a software development company based in the United States. It produces coding assistance tools and components for Delphi, C++ Builder and Microsoft Visual Studio developers. The major part of its product line is VCL, .NET WinForms and ASP.NET components that replicate the UI of Microsoft Windows and Microsoft Office applications. Developer Express has won many industry awards for its products.

DevExpress WinForms 15.2.3 adds Diagram Control

$
0
0

A sample flowchart created using DevExpress WinForms.

Visually communicate complex information using data-linked diagrams and flowcharts.

DevExpress WinForms includes 130+ controls which help you emulate the UI of today's most popular productivity apps. Whether you need to reproduce the look and feel of Microsoft Office or to deliver data mining and decision support systems for your enterprise, DevExpress libraries have been built to help you intuitively present data to your end-users in the shortest possible time.

Updates in 15.2.3

New Controls

  • WinForms Diagram Control - Visually communicate complex information using data-linked diagrams and flowcharts.
  • WinForms Date Editor and Calendar - The calendar used in the WinForms Date Editor is now available as a standalone control.
  • WinForms Excel Data Source - Bind DevExpress WinForms data-aware controls to Microsoft Excel workbooks or CSV files.
  • Office Inspired Ring/Line Animations - The WinForms Progress Panel and Transition Manager now support Office inspired animation styles.
  • WinForms Tabbed Form - Incorporates a Tabbed MDI interface which allows you to eliminate the use of MDI managers.
  • WinForms Tabbed Pane Control– A SDI (Single Document Interface) navigation control that owns a collection of pages and uses buttons to navigate between them.
  • WinForms Toolbox Control - A Microsoft Visio inspired Toolbox control.

Enhancements

WinForms Grid Control

  • Data Cell Images - Data cells can now display custom images either to the left or right edge of the control.
  • Align Summary Values with Group Rows - Summary values can be displayed in group rows under corresponding column headers.
  • Partial Groups - Display group rows with two or more data rows.
  • Grid-Based Report Generation - Invoke the DevExpress WinForms Report Designer from the Grid Control and create reports based on its data.

WinForms App UI Manager

  • New layout mode allows you to mix vertical and horizontal tabbed groups in Tabbed Views.

WinForms Chart Control

  • New Financial Indicators - This release ships with financial indicators including AverageTrueRange, CommodityChannelIndex, DetrendedPriceOscillator and MassIndex.

WinForms Layout Control

  • Resizing - You can view an item's current size during resize operations.
  • Search within Customization Form - You can now locate items by entering their names in the search box.

WinForms Map Control

  • Data Clustering - Aggregate data using the DevExpress Map Control's new clustering methods.
  • Vector Data Export/Import Enhancements - Import SVG vector graphics and export its vector data to KML, SVG and Shapefiles.

WinForms PDF Viewer

  • Open/Save Attachments - You can open and/or save attachments as needed.

WinForms Property Grid Control

  • HTML Formatting - Row headers and data cells now support HTML text formatting.

WinForms Ribbon Control

  • Recent Items - Emulate menus introduced in the newest version of Microsoft Office.

WinForms Rich Editor Control

  • Custom Drawing Using Layout API - Draw lines, shapes and text above, below or in place of page elements.
  • Nested Comments - Comments and replies are grouped and displayed as a conversation.
  • Improved PDF Export - PDF algorithms have been optimized. It's now twice as fast and consumes 30% less memory.

WinForms Scheduler Control

  • Time Indicator - The Scheduler now indicates current time.
  • Time Zone Information for Each Appointment - Associate time zones with individual appointments.

WinForms Snap Reporting Control

  • Data Source Wizard Customization - Manage data source lists, remove default wizard pages, create and add custom pages.

WinForms Spreadsheet Control

  • Pivot Tables - Analyze, categorize and summarize large volumes of data within a worksheet.
  • API Improvements - Create a pivot table from a cell range or a PivotTable cache, modify and remove existing pivot tables.

WinForms TreeList Control

  • Cell Selection - The WinForms TreeList control now supports selection of multiple cells.
  • Drag and Drop Enhancements - You no longer need to handle events and write code to enable drag and drop for multiple nodes within the DevExpress WinForms TreeList control.

WinForms MVVM and Scaffolding

  • New Services - This release provides four new services for the MVVM platform: notification, splash screen, layout serialization and print preview.
  • Data Binding Improvements - The MVVM Framework supports binding to properties, commands and event-to-command behaviors for nested ViewModels.
  • View Scaffolding - You can now create MVVM Application parts (Model, ModelViews and Views) based on an Entity Framework Model.

WinForms Application Themes

  • New Office 2016 Inspired Themes - This release ships with the following Office 2016 inspired themes: Office 2016 Colorful Theme and Office 2016 Black Theme.

About DevExpress (Developer Express)

DevExpress (Developer Express) is a software development company based in the United States. It produces coding assistance tools and components for Delphi, C++ Builder and Microsoft Visual Studio developers. The major part of its product line is VCL, .NET WinForms and ASP.NET components that replicate the UI of Microsoft Windows and Microsoft Office applications. Developer Express has won many industry awards for its products.

FastReport VCL 5.4 released

$
0
0

Sample report created using FastReport VCL.

Adds support for Embarcadero RAD Studio 10 Seattle.

FastReport VCL is a component that allows your application to generate reports quickly and efficiently. FastReport provides all the necessary tools to develop reports, including a visual report designer, a reporting core and a preview window. It can be used in Embarcadero Delphi or C++Builder.

FastReport is available in the following editions:

Updates in 5.4

  • Cache images when using matrix export filters.
  • QR Code and other 2D barcodes now support different codepages including UTF 8.
  • Support for Embarcadero RAD Studio 10 Seattle on 32 and 64-bit Windows platforms.
  • Added export filters package with basic export filters (BMP, JPEG, PNG, HTML and HTML5) for Lazarus IDE.
  • IBX internal dataset support for Lazarus IDE.
  • Increased maximum rows/columns/cells in cross-tab reports.

About Fast Reports

Founded in 1998 by Alexander Tzyganenko, Fast Reports, builds reporting applications, libraries and add-ons. It is an international company with offices in USA, Europe and Africa. They have dealers and partners in 50+ countries and have more than 20,000 customers worldwide.

Syncfusion Essential Studio for UWP 2017 Volume 4

$
0
0
Image Editor control.

Adds new image editor, a new Smith chart, and right-to left support for rich text box.

Features

  • Image Editor - New control - The image editor control lets users annotate images with freehand drawing, text, and shapes. It is also possible to perform simple image manipulation operations like cropping, flipping, and rotation.
    • Image cropping.
    • Image annotation with text, arrows, and shapes.
    • Image rotation and flipping.
    • Image zooming and panning.
    • An interactive toolbar for customization.
  • Smith Chart - New control - Smith chart is one of the most useful data visualization tools for high frequency circuit applications.
    • Visualization of the impedance and admittance of a transmission line.
    • Representation of data with line series and various types of markers.
    • Data label support for better readability.
    • Interactive tooltip support.
    • Interactive legend.
    • Customizable colors.
  • Calculate
    • Array formula calculation - Support has been provided for array formula calculation as in Microsoft Excel. An array formula is a formula that can perform multiple calculations with an array or series of data values and return one or more results. It helps to simplify the formula expression. For example, “=MAX (B1-C1, B2-C2, B3-C3, B4-C4, B5-C5)” can be replaced by the array formula, “{=MAX (B1:B5-C1:C5)}”.
  • Chart
    • Multi-level axis labels - Multi-level axis label support has been provided for the chart control.
  • Data Grid
    • Built-in row drag and drop - Support has been added for dragging and dropping rows in a data grid or between two data grids. This feature also allows rows to be dragged and dropped to and from any other control.
    • Grid column enhancements
      • Provided support to automatically generate columns for the details view grid when items source changed at runtime.
      • Provided read-only support for the data grid where users can enter edit mode but can’t input text.
      • Provided support to load different ItemsSource for combo box based on underlying data object.
  • Diagram
    • Quick Commands - Support has been provided for customizing the appearance and position of quick commands.
    • Dock Port - A dock port is a place holder that allows you to create connections at any point on it.
    • Auto-align - Support has been provided to align nodes or annotations automatically if they overlap.
  • Essential DocIO
    • Clone and merge enhancements - An option has been added to restart or continue list numbering when merging Word documents.
  • Numeric Up-Down
    • Customization - Numeric up-down now supports custom view, images, and a font icon with increment and decrement buttons.
  • Pivot Client
    • Layout for mobile view - The pivot client control appearance is now customized in such a way that it can be comfortably viewed and operated in mobile devices.
  • Pivot Grid
    • Excel-like filtering (Relational DB) - The pivot grid control supports sorting along with filtering values by label and value. This is available only for relational data sources.
    • Top summary layout (Relational DB) - The pivot grid control can now display summary data in rows or columns at the beginning of the value cells.
    • Dynamically change the properties of a calculation item (Relational DB) - The pivot computation information dialog allows you to change or edit value formats, summary types, calculation types, and field headers of a calculation item at run time.
  • Calendar
    • Vertical Swiping - Calendar provides vertical swiping support to navigate through a calendar’s months.
    • Agenda View - Calendar supports an agenda view, in which appointments will appear on the bottom of the calendar month view.
  • Gantt
    • Toolbar - The toolbar contains options for editing, expanding, collapsing, indenting, outdenting, and deleting selected tasks. It also contains options for adding new tasks.
    • Strip lines - Important days or events in a project can be highlighted using strip lines.
    • Exclude weekends - Support has been added to exclude weekends from task duration.
  • Rich Text Box
    • Right-to-left support - The rich text box control allows the user to view and edit right-to-left content such as text, paragraphs, lists, and tables.
    • Drag-and-drop support - The rich text box control allows the user to drag and drop content within the control.
  • Spreadsheet
    • Array formula calculation - Support has been provided for array formula calculation as in Excel. An array formula is a formula that can perform multiple calculations with an array or series of data values and return one or more results. It helps to simplify the formula expression. For example, “=MAX (B1-C1, B2-C2, B3-C3, B4-C4, B5-C5)” can now be replaced by the array formula, “{=MAX (B1:B5-C1:C5)}”.
  • Tree Grid
    • Footer column - Support has been added for freeze columns (non-scrolling columns) on the right, like in Excel.
    • Stacked header - Support has been added for stacked header rows, which are unbound header rows that can span multiple rows and columns to group one or more header cells.

Syncfusion Essential Studio Enterprise 2017 Volume 4

$
0
0
Syncfusion Essential Studio Enterprise

Includes improvements and additions across the entire library of controls.

Features

  • ASP.NET MVC - A new combo box component allows users to select an option from a defined list of values. The drop-down list control now supports server filtering for remote and local data. The tree grid now supports stacked column headers.
  • ASP.NET Core - A new date-range picker control allows users to select from a predefined or custom set of dates. A new combo box component allows users to select an option from a defined list of values. A new pivot client control allows the visualization of both OLAP and relational data in pivot grids and pivot charts.
  • ASP.NET Web Forms - A new combo box component allows users to select an option from a defined list of values. The drop-down list control now supports server filtering for remote and local data. The tree grid now supports stacked column headers.
  • JavaScript - Essential JS2 and Ember support each bring a wealth of new functionality to our JavaScript controls. A new combo box component allows users to select an option from a defined list of values.
  • Xamarin.Forms - The new diagram control can be used to create a wide range of diagrams, including flow charts, use case diagrams, workflow processes, and more. Multicolumn grouping is now possible simply by setting an API. The image editor control now supports zooming and panning.
  • Xamarin.Android - The new diagram control can be used to create a wide range of diagrams, including flow charts, use case diagrams, workflow processes, and more. The image editor control now supports zooming and panning.
  • Xamarin.iOS - The new diagram control can be used to create a wide range of diagrams, including flow charts, use case diagrams, workflow processes, and more. The image editor control now supports zooming and panning.
  • UWP - The new image editor control lets users annotate and manipulate images. The new Smith chart makes visualizing high frequency circuit applications easier than ever, with data label support, interactive tooltip support, interactive legend, and color customization. The rich text box now supports viewing and editing right-to-left content.
  • Windows Forms - The ribbon control now supports different icons for the quick access toolbar. The spreadsheet control has new support for array formula calculation. The date-time picker now has Microsoft Office 2016 theme support for improved aesthetics and usability.
  • WPF - The data grid control now has built-in row drag-and-drop for moving columns between grids. The new Smith chart makes visualizing high frequency circuit applications easier than ever, with data label support, interactive tooltip support, interactive legend, and color customization. The rich text box now supports viewing and editing right-to-left content.

Stimulsoft Reports for Flex 2018.1

$
0
0
New Wizards for Creating Reports

New report wizards allow you to easily create Invoices, Orders and Quotes.

Features

  • New Wizards for Creating Reports - New report wizards have been added that allow you to create Invoices, Orders and Quotes. After creating the report, you can edit the template in the report designer.
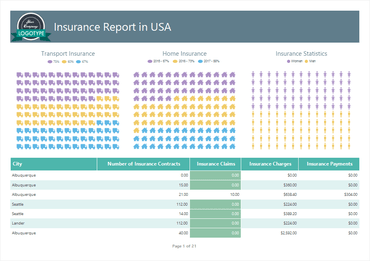
  • Pictorial Chart - To visualize the values in this chart, various icons are used. For each row of the chart, you can specify an icon.
  • Mobile Mode for HTML5 Viewer - In this release, the HTML5 viewer has been adapted to work on mobile devices. You can now view reports and export them directly from your mobile device.
  • Settings in the Data Dictionary - All data dictionary settings are now shown in a separate menu.
  • Report Designer Notification Menu - Allows you to see information about the release of new versions, as well as expiration of your Stimulsoft subscription.

Stimulsoft Reports for Java 2018.1

$
0
0
Pictorial Chart

Adds new Pictorial Chart report.

Features

  • New Wizards for Creating Reports - New report wizards have been added that allow you to create Invoices, Orders and Quotes. After creating the report, you can edit the template in the report designer.
  • Pictorial Chart - To visualize the values in this chart, various icons are used. For each row of the chart, you can specify an icon.
  • Mobile Mode for HTML5 Viewer - In this release, the HTML5 viewer has been adapted to work on mobile devices. You can now view reports and export them directly from your mobile device.
  • Settings in the Data Dictionary - All data dictionary settings are now shown in a separate menu.
  • Report Designer Notification Menu - Allows you to see information about the release of new versions, as well as expiration of your Stimulsoft subscription.

Stimulsoft Reports for PHP 2018.1

$
0
0
New Wizards for Creating Reports

New report wizards allow you to easily create Invoices, Orders and Quotes.

Features

  • New Wizards for Creating Reports - New report wizards have been added that allow you to create Invoices, Orders and Quotes. After creating the report, you can edit the template in the report designer.
  • Pictorial Chart - To visualize the values in this chart, various icons are used. For each row of the chart, you can specify an icon.
  • Mobile Mode for HTML5 Viewer - In this release, the HTML5 viewer has been adapted to work on mobile devices. You can now view reports and export them directly from your mobile device.
  • Settings in the Data Dictionary - All data dictionary settings are now shown in a separate menu.
  • Report Designer Notification Menu - Allows you to see information about the release of new versions, as well as expiration of your Stimulsoft subscription.

Stimulsoft Reports.JS 2018.1

$
0
0
Pictorial Chart report

Adds new Pictorial Chart report.

Features

  • New Wizards for Creating Reports - New report wizards have been added that allow you to create Invoices, Orders and Quotes. After creating the report, you can edit the template in the report designer.
  • Pictorial Chart - To visualize the values in this chart, various icons are used. For each row of the chart, you can specify an icon.
  • Mobile Mode for HTML5 Viewer - In this release, the HTML5 viewer has been adapted to work on mobile devices. You can now view reports and export them directly from your mobile device.
  • Settings in the Data Dictionary - All data dictionary settings are now shown in a separate menu.
  • Report Designer Notification Menu - Allows you to see information about the release of new versions, as well as expiration of your Stimulsoft subscription.

Stimulsoft Reports.Net 2018.1

$
0
0
New Insert Tab

New Insert Tab contains all the components needed to develop a report, grouped by type.

Features

  • New Wizards for Creating Reports - New report wizards have been added that allow you to create Invoices, Orders and Quotes. After creating the report, you can edit the template in the report designer.
  • Pictorial Chart - To visualize the values in this chart, various icons are used. For each row of the chart, you can specify an icon.
  • Mobile Mode for HTML5 Viewer - In this release, the HTML5 viewer has been adapted to work on mobile devices. You can now view reports and export them directly from your mobile device.
  • Automatically Check Expressions - When you change an expression, it is now automatically checked. If there is an error it is displayed in the text editor.
  • New Insert Tab - This tab contains all the components needed to develop a report, grouped by type.
  • Settings in the Data Dictionary - All data dictionary settings are now shown in a separate menu.
  • Report Designer Notification Menu - Allows you to see information about the release of new versions, as well as expiration of your Stimulsoft subscription.

Stimulsoft Reports.Ultimate 2018.1

$
0
0
Stimulsoft Reports.Ultimate

Adds native .NET Core support.

Features

  • Native .NET Core Support - Includes a report designer and easy-to-use tools for report exporting and printing.
  • New Wizards for Creating Reports - New report wizards have been added that allow you to create Invoices, Orders and Quotes. After creating the report, you can edit the template in the report designer.
  • Pictorial Chart - To visualize the values in this chart, various icons are used. For each row of the chart, you can specify an icon.
  • Mobile Mode for HTML5 Viewer - In this release, the HTML5 viewer has been adapted to work on mobile devices. You can now view reports and export them directly from your mobile device.
  • Automatically Check Expressions - When you change an expression, it is now automatically checked. If there is an error it is displayed in the text editor.
  • New Insert Tab - This tab contains all the components needed to develop a report, grouped by type.
  • Settings in the Data Dictionary - All data dictionary settings are now shown in a separate menu.
  • Report Designer Notification Menu - Allows you to see information about the release of new versions, as well as expiration of your Stimulsoft subscription.

Stimulsoft Reports.Web 2018.1

$
0
0
Stimulsoft Reports.Web

Adds native .NET Core support.

Features

  • Native .NET Core Support - Includes a report designer and easy-to-use tools for report exporting and printing.
  • New Wizards for Creating Reports - New report wizards have been added that allow you to create Invoices, Orders and Quotes. After creating the report, you can edit the template in the report designer.
  • Pictorial Chart - To visualize the values in this chart, various icons are used. For each row of the chart, you can specify an icon.
  • Mobile Mode for HTML5 Viewer - In this release, the HTML5 viewer has been adapted to work on mobile devices. You can now view reports and export them directly from your mobile device.
  • Settings in the Data Dictionary - All data dictionary settings are now shown in a separate menu.
  • Report Designer Notification Menu - Allows you to see information about the release of new versions, as well as expiration of your Stimulsoft subscription.
Viewing all 1653 articles
Browse latest View live


<script src="https://jsc.adskeeper.com/r/s/rssing.com.1596347.js" async> </script>